

TABLE OF CONTENTS
Device

Figure 1
The sensor is available in various lengths. The stardard length is measuring up to 15cm while longer versions can measure up to 1 meter depth (see figure 2).

Figure 2
Specification
Item | Specification |
Material | Polyethylen (PE), UV resistant |
Measured values |
|
Secondary sensors |
|
Recorded metadata | When the sensor is activated, the following metadata is added: Protocol ID, trial discipline, Trial ID, trialist name, crop, sowing date, soil texture, pH, salinity, irrigation, experimental design, GPS, installation depth, soil preparation, variety, plot number, plot size, unit presentation, application date |
Measurement method soil moisture | Suction tension measurement of plant-available water |
Battery life | Up to 5 years with one charge (depending on the configuration) |
Data transmission | LoRaWAN (Long Range Wide Area Network) |
Initialization and Update | NFC |
Configuration |
|
Recording of the metadata | Web Application, access via QR code, or direct link and PC |
Data evaluation | Online platform with analysis and modeling toolbox |
Encryption | 256bit encryption end-to-end (sensor to database) |
Certificates | CE, IP67 |
Type of distribution / price | Rental or sales model depending on purchasing amount, All inclusive: Sensor, Connectivity, Spotfire access for data visualization. Monthly subscription fee. |
Connection to platform | Standard connection to Spotfire and Valenco UI. |
Application
This sensor is intended to be used in soil. It measures temperature and soil moisture. The sensor may only be used in accordance with this manual for handling.
Data Transmission

Figure 3
In France, Switzerland, Belgium and the Netherlands, a country-wide LoRa network is available. The sensors are thus expected to send live data except for some areas where coverage might not be given. In all other countries the sensors will log the data (up to 6 month), or a local network will be established. If the sensors are used in logginf mode, data will be uploaded once the sensors are either sent back to Valenco or to a defined collection point.
Sensor Installation
This section describes the intended handling of the sensor. Please follow the instructions closely.
For the installation the material specified below is required:
Sensor(s)
Bucket
Shovel or similar digging tool
Water
Mobile phone or computer
Password and username for Valenco Webapp which you received via email (if not, contact support@valenco.ch)
Sensor Preconditioning
Before sensor installation, the Watermark sensor needs a certain preconditioning in water. Once a sensor was out of the soil for two days or more, preconditioning should be performed again. This is done to improve sensor response during the first few irrigations. To correctly set up the sensor, the following steps should be completed:

Figure 4
During the soaking procedure the whole metal part of the sensor should be covered in water (see Figure 5).

Figure 5
Sensor Installation
Good locations for positioning of the sensors are the check plots of your trial, one sensor per plot, within a row, if not requested differently by the protocol owner.
For sensor installation, a hole of the required depth needs to be made. Its diameter should slightly exceed the sensor diameter (25mm/1”). Once the hole is prepared, the sensor can be placed.
To place the sensor at the desired depth, keep an eye on the marks you can see on the sensor (see figure 6). You will be able to enter the amount of marks still visible after planting the sensor in our system, this way the system knows how deep the sensor was dug in. If you know the required depth and want to calculate the number of marks that must be visible for the respective depths, see figure 6.
The calculated depth is measured from the center of the watermark sensor to each mark on the shaft of the housing.
Example: If you intend to place the middle of the watermark sensor at 14 cm deth/5.5 inch you need to make sure that the top mark is at soil level (0 visible marks above soil level). If your intention is to place the middle of the sensor at 6.5cm depth (minimal depth) the first mark should be at soil level and 5 additional marks should be visible.

If not desired differently, or not stated otherwise: place the sensors at 14 cm depth.
To finish the physical sensor placement, mud is produced by mixing field soil with water. The space around the sensor is then filled with the mud (see figure 7 & 8). If necessary, some additional soil is added, so that the sensor can not wiggle anymore.
These general rules should be followed when installing a sensor into the ground:
The soil in the area surrounding the sensor should not be excessively compacted/hardened. This can be avoided by digging a hole large enough to easily fit the sensor.
The sensor must have full contact with the surrounding soil, this is very important to make sure the collected data is useful.
Figure 7
| Figure 8
|
Space around the sensor is filled with a soil slurry | Sensor placed in a corn field |


Sensor Activation
Once the sensor is physically installed, it needs to be activated in the Valenco system. This activation is very important because this step will connect the data with your trial. You can use your mobile phone or conduct the activation via the Valenco page on your computer either before or after the physical sensor placement in your trial. If you choose to activate the sensors via computer, you need to make sure that you know which Sensor/Device ID was placed at which position in your trial (plot number). In the picture below, find the activation process via mobile phone pictured:

During the activation, the following information on the trial is requested (bold fields are necessary):
Protocol ID (Use master protocol number! e.g.: IDMZ14RB-2023UN) |
Trial discipline (e.g. Herbicides, Seedcare; Seeds) |
Trial number (Use full trial number! e.g.: USNA0H0572020 |
Trialist name (First and last name for Syngenta employees, Company name for COR`s) |
Crop |
Sowing date |
Soil texture |
Organic matter % |
PH |
Salinity |
Irrigation |
Experimental design |
GPS Coordinates (automatic) |
Installation depth (number of visible marks) |
Soil preparation |
Variety |
Plot number |
Plot size |
Unit presentation (US/SI) |
Application date |
Not all information is required (only the ones in bold) and you can also enter/correct them later on the Valenco page (Settings → Trial information) except for the Protocol ID. This ID is very important to be correct, and you have to ask for support to have it changed.
The camera app of most smartphones today can recognize QR codes and automatically offer to open the Valenco web application. Some Android users may need to download a QR scanner app (recommended application: “QR & Barcode Scanner”) to be able to read the code. In case you do not have an internet connection in the field whilst making an activation, the process remains the same. However, once you are back in an area with internet connection, reload all the different website tabs you opened in the field so that the data is uploaded to the server.
 Figure 10
QR-Code activation
For the activation via QR code on site, perform the following steps:
Scan QR code on top of the sensor
Press “Activate” on the screen
Enter Protocol ID, choose “Trial discipline” and press “Ok”
Enter field Trial ID and press “Ok”
Enter trial-specific data and confirm with “Submit”
Enter activation-specific data and confirm with “Activate”
If, for some reason, the activation via QR-Code does not work, you can activate the sensors on your desktop PC as well. Therefore see “Desktop activation”.
Important note for Seedcare trialists: The protocol ID and the field trial ID are very important. Therefore the fields to enter them are not only mandatory, but also carry a restriction. For the protocol ID, only 15 character alphanumerical numbers are allowed and you should see a drop down menu from which you can choose the correct protocol ID. If your protocol ID is not listed, please reach out to support@valenco.ch. If you do not know your protocol ID, please reach out to your trial manager or Andrea Rodigari.
Respectively, the field trial ID is a 13 character alphanumerical number and must be entered correctly as well.
Desktop activation
Please make sure you write down, or take photos of the sensor Device ID in advance, so you can aassign the sensors correctly, assuming you have planted the sensors already.
Use this link and do the activation on the Valenco page: https://iotui.valenco.ch/iotUserInterface/index.jsf
For the activation on your computer perform the following steps:
For the login, use the credentials you received via mail or ask support@valenco.ch if you do not have any
Go to the tab called “Sensors”
In the left column, all sensors of Syngenta will be listed. Find your sensor by either scolling through the sensors or searching for it in the search field. You can search for it by entering the last 4 characters of the Device ID (e.g.: 0050C2FFFE992B8A).
Press “Activate”
Enter Protocol ID, choose “Trial discipline” and press “Ok”
Enter field Trial ID and press “Ok”
Enter trial-specific data and confirm with “Submit”
Enter activation-specific data and confirm with “Activate”
Next steps:
If performed correctly, the button next to the sensor will - after you have reloaded the page - display “Deactivate” and NOT “Activate” anymore. Please doublecheck this way whether the activation was successful.
Make sure that you activate the actual sensors you received and NOT someone else’s. If you make a mistake during the activation (e.g. used the wrong Trial ID) please contact support@valenco.ch to request modifications.
If the crop you are working with is not in the drop-down list, please let us know and it will be added.
Sensor Deactivation
When your trial is terminated it is important to deactivate the sensors to stop data being sent by the sensors. Here again, you have both possibilities (QR code and mobile phone or on the computer – see Sensor Activation). Press the “Deactivate” button to complete the action. You can also deactivate all sensors of your trial at the same time. Either then, or when you deactivate the last sensor of your trial, you are asked to enter the date of the sensor removal from your trial.
Sensor Removal
If a trial is terminated, and you need the senors somewehre else, carefully remove them from your field by excavating them. When advised to return them, see our Return Shipments page.
Data Visualization in Spotfire
For Syngenta users, a Spotfire application was set up for data visualization. If you are NOT a Syngenta internal user, you can skip this section and go to Soil Sensor Handling Guide | Data Platform Valenco.
If you have a Spotfire account, you can log in using your Syngenta credentials (Syngenta user number and your windows password) via this link:
If you don’t have an account, raise a “Service Now” request for a Spotfire Consumer account.
Service Catalogue > Software & Business Applications > Spotfire > I need Spotfire consumer access .
Alternatively, you can also do the following:
Go to Syngenta myIT & click on Request something
Expand the Software & Business Applications category on the left-hand side
Browse further down and expand the R&D IT section and click on Spotfire
Select and submit the I need Spotfire consumer access request
It is important that you request the Spotfire CONSUMER ACCESS not any of the other versions.
If any of these steps do not work, please contact IT support.
Landing Page
The landing page gives an overview on the soil temperature C°/F and plant available water in kPA (0 water saturated to-252 extremly dry).
In the Trial ID field, you can select your trial. You can also select multiple trials by Protocol ID using the control (ctrl) button and selecting the trials of interest.
If you enter just a part of the Trial ID followed and by a “*”, it will show you all trials with the letters/numbers before the “*”. For example if you enter “2021*” it will select all trials with 2021 within the ID. You can also select by Protocol ID or trialist name.
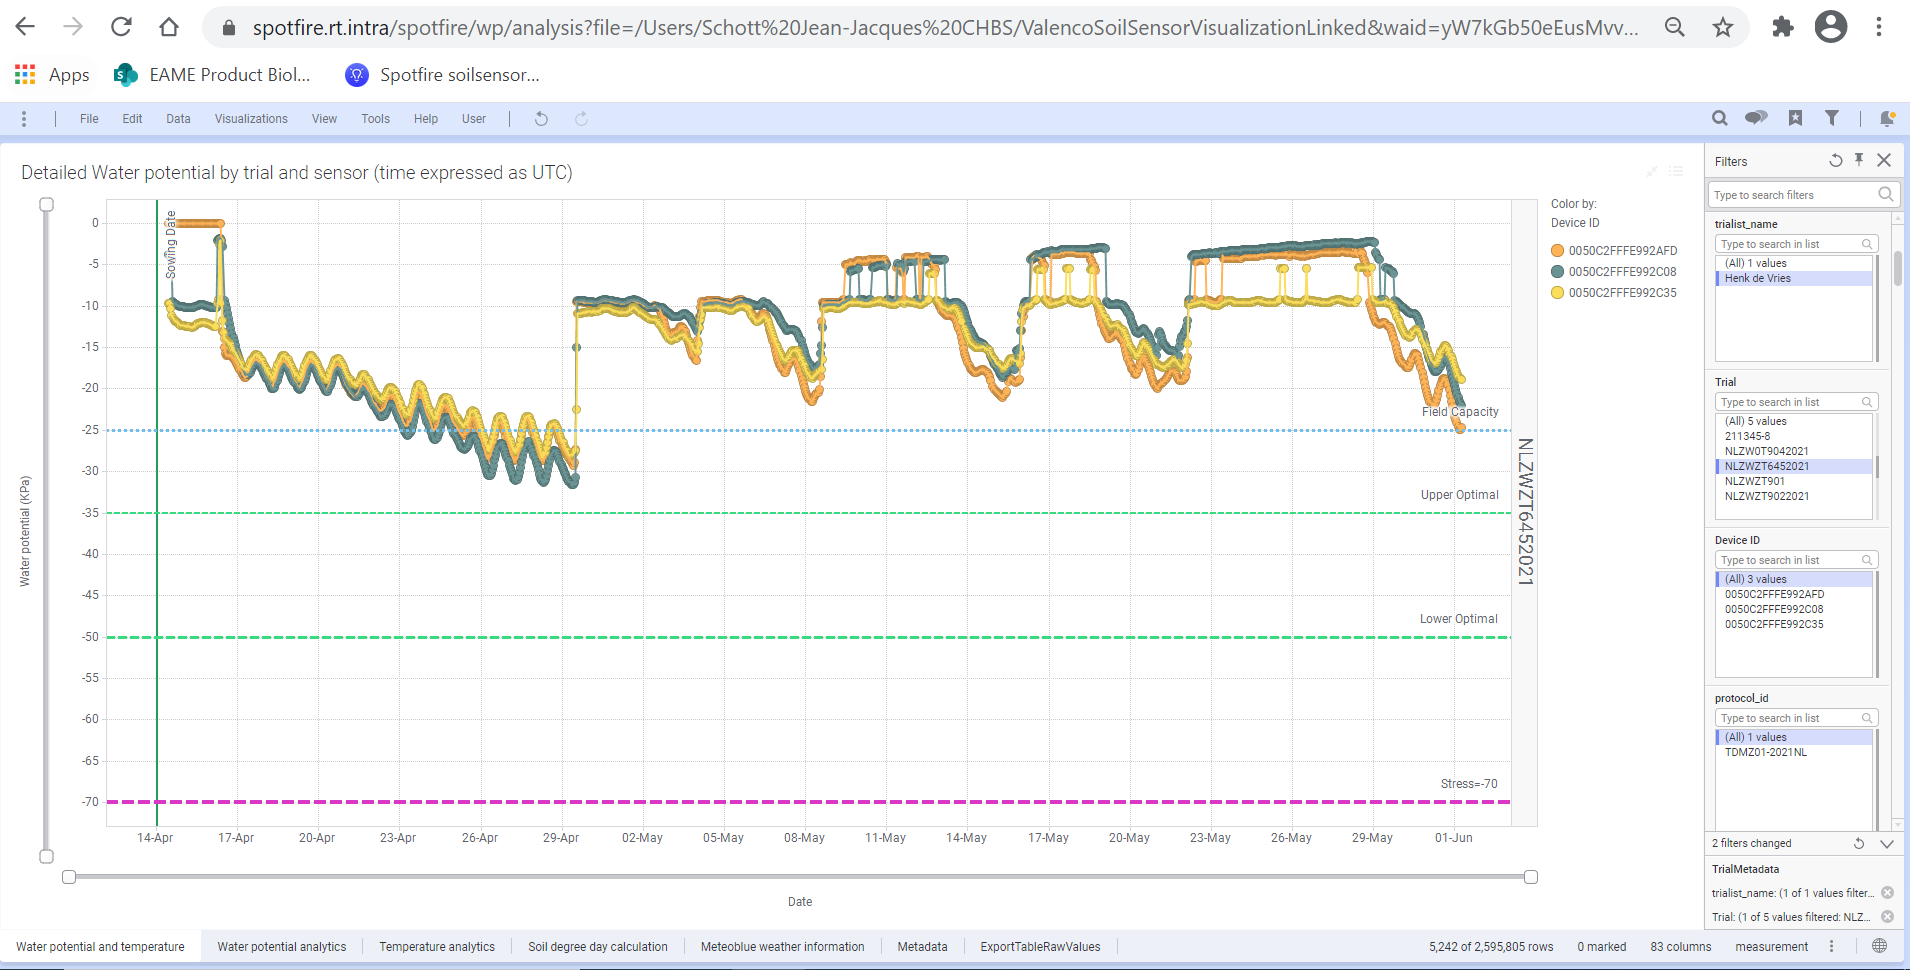
In this water potential and temperature tab, you will see all data points from all sensors (hourly measurements of water potential and temperature).
Thresholds indicate the moisture levels in the soil based on soil texture. On the right-hand side of the screen, you can further filter e.g. select/unselect single sensors under “Device ID”.
Important: to unselect the trial you looked at and select other trials from the list you need to “reset visible filters” below the selection masks on the left-hand side (see figure below).
If a control field is not shown fully you can enlarge it by pulling it wider with the mouse (this might happen depending on smaller screens).

Water potential Analytics
The “Water potential analytics” tab gives more detailed information on the water potential. You can select data in days relative to the sowing date, a reference date or the measurement day (date).
Data is displayed for every single sensor (left graph) and as an average of all sensors (on the right).
If you installed the sensors in the trial at different depth, this is displayed as well (depth in cm is displayed at the end of the Device ID).


Temperature Analytics
In the “Temperature analytics” tab, you can look at the minimum, maximum and average temperature per day for every single sensor in your trial and the average of all sensors. Also, with respect to the temperature you can compare different trials.

Soil Degree Day (SDD) Calculation
Soil degree days are calculated, for example, to understand how long it takes until a nematode lifecycle is completed (soybean cyst nematodes = 380 SDD; base temperature 10°C.) For the SDD calculation, the base temperature (e.g. 10°C is subtracted from the average daily temperature e.g. 15 °C = soil degree day of 5°C). Soil degree days are accumulated over time. The steeper the curve the higher was the temperature in a trial.


Meteoblue Weather Data
Precipitation and air temperature from Meteoblue weather data is displayed under the “Meteoblue weather information” tab.
This data displayed for a location is extrapolated from the nearest Meteoblue weather station. The distance is displayed above the Precipitation/Soil Water Potential/ Relative Humidity graph. Additionally, the forecast for the next 7 days is displayed.

Metadata
All metadata that you entered during the activation is displayed in the “Metadata” tab together with a satellite image of the trial location.

Data, graph display and download
All graphs on the Spotfire webapp can be downloaded as PDF files or images by using the right mouse button.
Data from every trial is displayed as a table under “ExportTableRawValues” and can be downloaded in .xlsx format by using the right mouse button.

For further details or an online introduction to the Spotfire visualization, please contact andrea.rodigari@syngenta.com.
Data Platform Valenco
The data is also available online on the Valenco User Interface. This page is thought to act as a displaying platform for all external parties that work for Syngenta but do not have access to Spotfire.
Please contact support@valenco.ch if you wish to get an introduction or have any questions. The following URL and the credentials you received via email are needed to access the data:
https://iotui.valenco.ch/iotUserInterface/login.jsf
Soil sensor data and weather data
Water potential and temperature of all soil sensors are displayed as well as meteoblue data on precipitation and air temperature. You will also find a satellite picture of the trial location. To switch between the different values, use the various tabs on top of the page.
Download sensor data
If required, you can download your data from this platform in an .xlsx or .csv file format. Select the data you want to download by trial or sensor. Select the time of interest and click on “Download Data”. You will pull down all data that is displayed on the graph the moment you download it.
Edit trial metadata
Furthermore, you can edit the metadata (except the Protocol ID) you entered during the activation when selecting “Settings”, then “Trial Information” and then choosing your trial or activation period.


 Figure 23 - Settings view. Trial metadata can be corrected here.
For general questions or to order your sensors please contact:
Andrea Rodigari - andrea.rodigari@syngenta.com
For help with the setup please contact:
Valenco GmbH – support@valenco.ch